

MD&A · 2025
In this section4 topics
Overview of Operations
Overview of Operations
In 2025, the Company had sales revenue of THB 23,890.3 million, decreasing in amount to THB 1,111.8 million or 4.4% YoY. Total sales volume amounted to 37,102 million pieces, decreasing in amount to 3.8% YoY. The average selling price for the year was THB 636 per thousand pieces, decreasing by 0.8% YoY due to the appreciation of the Thai Baht, although the average selling price in U.S. dollars increased by 6.5% YoY to USD 19.44 per thousand pieces. The Company reported a net loss of THB 108.6 million, decreasing in amount to 110.9% YoY, mainly due to the recognition of Non-recurring items in the second half of the year, including expenses related to the flood incident, impairment losses on assets, and provisions associated with suspended projects.
However, excluding these Non-recurring items, the Company maintained the operating performance, recording a profit before tax of THB 549.1 million in 2025, equivalent to a pre-tax profit margin of 2.3%.
2025 | 2024 | %YoY | |
Volume (in million pcs) | 37,102.2 | 38,548.8 | (3.8%) |
Sales Revenue | 23,890.3 | 25,002.1 | (4.4%) |
COGS | (21,709.7) | (22,832.8) | (4.9%) |
Gross profit | 2,180.6 | 2,169.4 | 0.5% |
Other income and dividend income | 259.7 | 634.3 | (59.1%) |
SG&A | (2,472.5) | (1,733.2) | 42.7% |
Loss on exchange rate | (194.3) | (64.7) | 200.4% |
Other loss, net | 60.1 | 55.1 | NM |
Operating profit (loss) | (166.4) | 1,060.9 | NM |
EBITDA | 2,640.3 | 3,416.9 | (22.7%) |
EBIT | 0.1 | 1,371.4 | (100.0%) |
Finance income | 166.4 | 310.6 | (46.4%) |
Finance costs | (235.4) | (291.5) | (19.2%) |
EBT/ LBT | (235.4) | 1,079.9 | NM |
Tax | 126.8 | (84.6) | NM |
Net profit/ (Loss) | (108.6) | 995.3 | 110.9 |
GP margin | 9.1% | 8.7% | 0.5% |
EBITDA margin | 11.1% | 13.7% | (2.6%) |
Net profit margin | 0.5% | 4.0% | (4.4%) |
Financial Ratio | |||
Current ratio | 2.17 | 1.94 | 12.3% |
Cash cycle (days) | 49.75 | 47.74 | 4.2% |
Net IBD/E | 0.04 | 0.05 | (15.1%) |
Interest coverage ratio | 11.21 | 11.72 | (4.3%) |
ROA | 0.2% | 2.1% | (111.1%) |
ROE | 0.3% | 2.6% | (110.9%) |
Operating Results & Financial Condition
Operating Results & Profitability
Sales revenue
In FY2025, Sales Revenue was THB 23,890.3 million, decreasing by THB 1,111.8 million or 4.4% YoY. In 2025, the sales mix comprised Natural Rubber Powdered (NRPD) gloves (NRPD) at 33%, Natural Rubber Powder-Free gloves (NRPF) at 35%, and Nitrile Butadiene Rubber gloves (NBR) at 32%. The average selling price for 2025 was THB 636 per thousand pieces (USD 19.44), decreasing by 0.8% YoY. The Thai Baht appreciated against the U.S. dollar by 6.9% YoY. Total sales volume for 2025 was 37,102 million pieces, representing a 3.8% YoY decrease. The overall rubber glove industry continued to face pressure from intensified competition, the U.S. Reciprocal Tariff measures, the strengthening of the Thai Baht, and volatility in raw material prices. Nevertheless, the Company maintained flexible production capabilities, particularly in the powder-free product segment, allowing partial switching between NRPF and NBR gloves based on market demand at each period. This flexibility enabled the Company to manage the product portfolio efficiently across both Natural and Nitrile rubber gloves, together with diversified market coverage across multiple regions worldwide. Such diversification helped reduce the risk of over-dependence on any single market and enhanced the Company’s ability to withstand industry volatility. The utilization rate for 2025 was 77.7%, decreasing from 82.8% in the previous year.
Gross profit
In FY2025, Gross profit was THB 2,180.6 million, increasing by 0.5% YoY due to a slight reduction in costs. The gross profit margin improved to 9.1%, compared to 8.7% in the previous year, as a result of a decrease in cost of sales at a higher rate than the decrease in sales revenue, supported by the lower prices of key raw materials during the year.
Selling and Administrative Expenses (SG&A)
In FY2025, SG&A expenses was THB 2,472.5 million, increasing by 42.7% YoY, representing an SG&A/Sales of 10.3%. The increase was mainly due to higher administrative expenses arising from non-recurring expenses recognized in the second half of the year. Most of these expenses were recorded in the fourth quarter of 2025, in amount to THB 634.0 million, comprising: (1) expenses related to the flood incident in Hat Yai District, Songkhla Province, which were largely recognized in the fourth quarter of 2025; (2) impairment losses for obsolete buildings and machinery that the Company has ceased using as part of its transition to modernized production technologies to enhance efficiency and reduce long-term costs, together with other related expenses; and (3) provisions for the deterioration of construction-in-progress assets of a facility for which capacity expansion had previously been suspended.
Excluding all non-recurring items, SG&A expenses for 2025 would decrease to THB 1,786.3 million, representing an SG&A/Sales of 7.5%, slightly higher than the 6.9% recorded in the previous year.
Gain (Loss) on Exchange Rate and Other Gains (Losses)
In FY2025, The Company had a net loss on exchange rate and other gains (losses) of THB 134.2 million, increasing from a loss of THB 9.6 million in the previous year. The higher loss was mainly due to the recognition of losses from financial derivative instruments.
Other income
In FY2025, the Company had other income of THB 259.7 million, decreasing by 59.1% YoY, mainly due to a reduction in interest compensation received under the support program of the Rubber Authority of Thailand (RAOT). In 2024, the Company recognized such income, including interest compensation during construction, in amount of THB 483.2 million, whereas in 2025, the amount recognized was THB 88.8 million.
Finance costs
In FY2025, Finance costs was THB 235.4 million, decreasing by 19.2% YoY, resulting from the repayment of short-term loans, debentures, and long-term borrowings, which led to lower interest expenses.
Income Tax Expense (Income)
In FY2025, the Company recognized income tax income of THB 126.8 million, consistent with the pre-tax loss of THB 235.4 million. This was mainly due to the recognition of deferred tax assets arising from tax losses incurred during the year.
EBITDA
In FY2025, EBITDA excluding non-recurring items was THB 3,425.6 million, decreasing by 0.3% YoY, with an EBITDA margin of 14.3%, increasing from 13.7% in the previous year. Meanwhile, EBITDA including all non-recurring items for 2025 amounted to THB 2,640.3 million, decreasing by 22.7% YoY, with an EBITDA margin of 11.1%, down from 13.7% in the previous year.
Net Profit
In FY2025, The Company had a net loss of THB 108.6 million, decreasing by 110.9% YoY, representing a net loss margin of 0.5%.
Liquidity & Capital Adequacy
Debt Service Ability and Compliance with Loan Covenants
As of 31 December 2025, the Company had borrowings comprising short-term loans, long-term loans from financial institutions, debentures, and lease liabilities in amount of THB 4,505.8 million (Please refer to Notes 16 to the Financial Statements for further details regarding maturities, interest rates, and outstanding commitments by currency). The Company is required to comply with certain key financial covenants on a quarterly basis, as follows:
Covenant | Condition | 1Q68 | 2Q68 | 3Q68 | 4Q68 | Compliance Result |
Long-term Loan Agreement | ||||||
Net Debt to Equity | Consolidated financial statements not exceeding 3:1* | 0.03 | 0.06 | 0.03 | 0.04 | Complied |
* Lease liabilities are excluded from the calculation.
Credit Policy for Customers
The Company has established credit terms for each customer in accordance with their respective risk levels, taking into consideration several factors such as business size, nature of operations, financial position, payment history, and approved credit limits. The average credit term for general customers is not more than 60 days.
Asset Management Capability
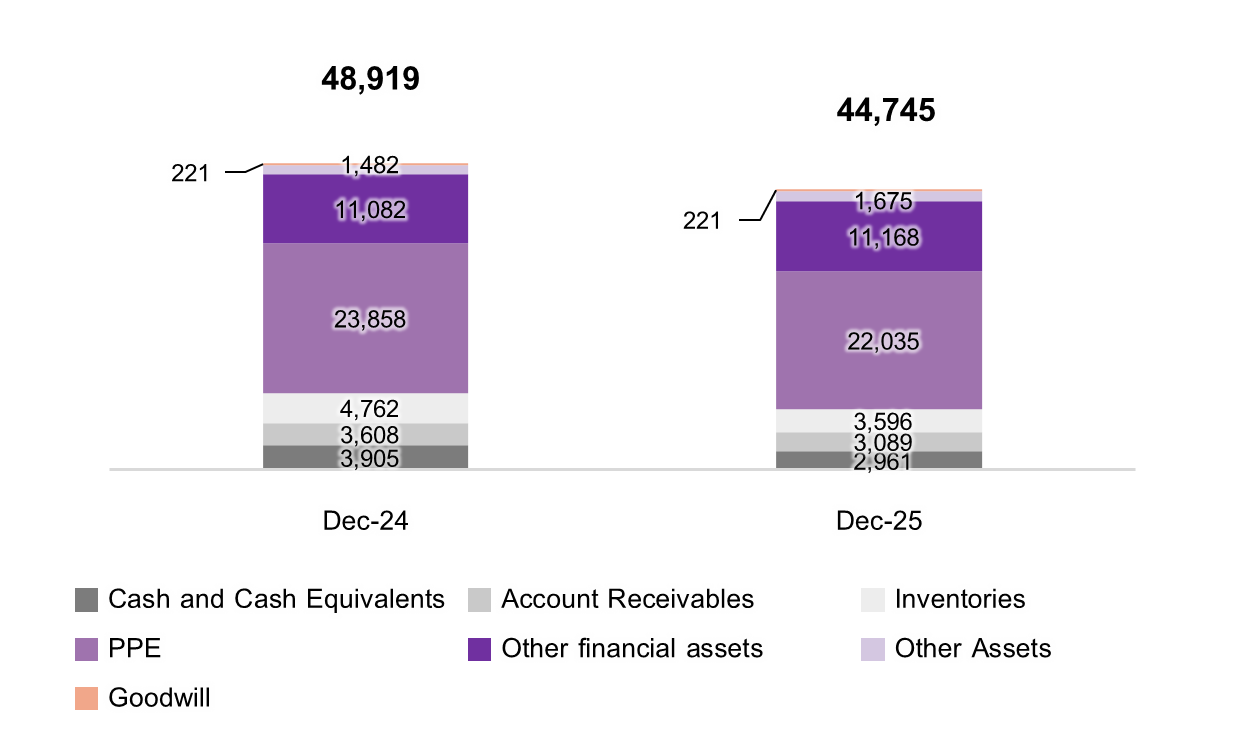
Total Assets
As of 31 December 2025, the Company had total assets of THB 44,745 million, decreasing by 8.5% from 31 December 2024. Key asset components included cash and cash equivalents of THB 2,960.7 million, trade and other receivables of THB 3,089.4 million, inventories of THB 3,596.2 million, other non-current financial assets of THB 11,168 million, and property, plant and equipment of THB 22,035.3 million.
The decrease in total assets was mainly due to a decrease in property, plant and equipment due to depreciation in line with asset useful lives and the recognition of impairment losses on buildings and machinery. Inventories and trade receivables also declined, consistent with lower raw material prices and selling prices, as well as inventory damaged by the flood incident. In addition, other financial assets under current assets decreased due to an increase in investments in non-current financial assets.
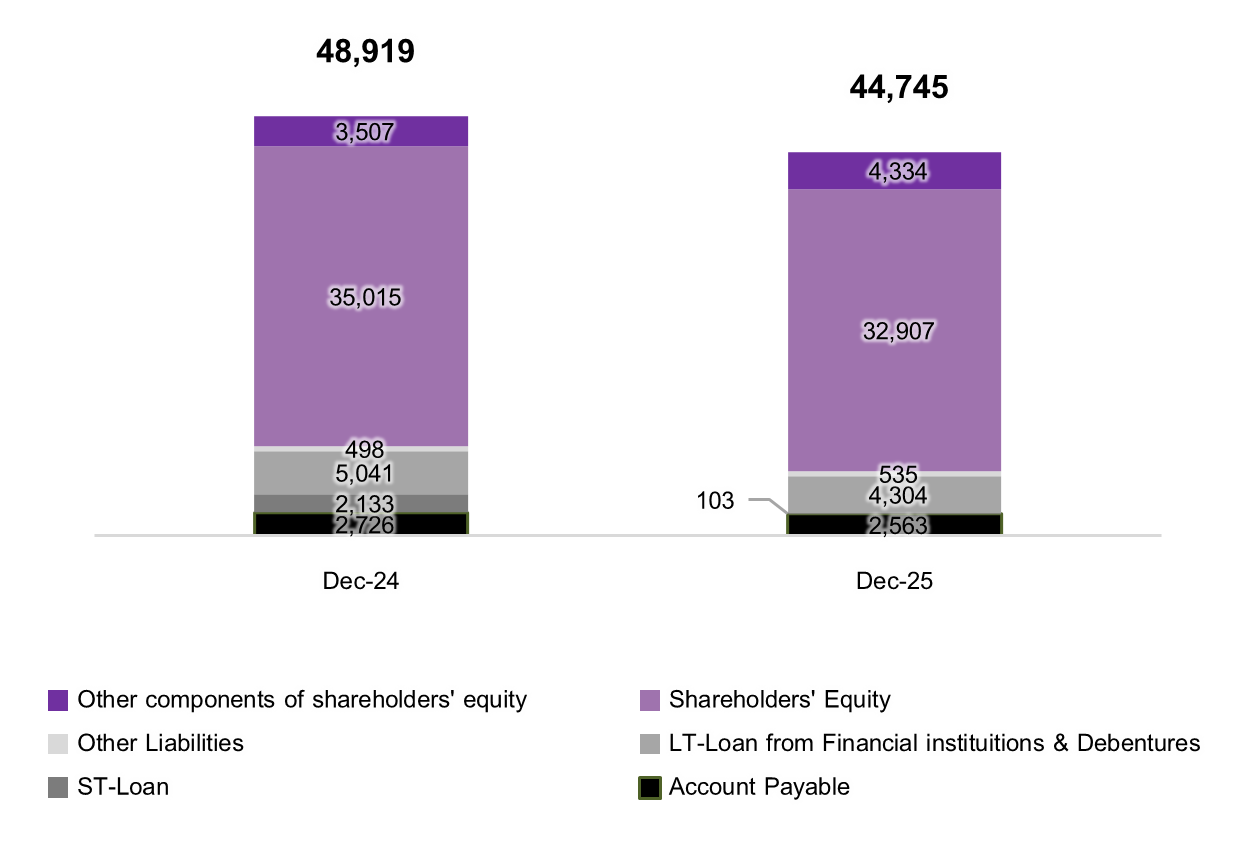
Total Liabilities
As of 31 December 2025, total liabilities were THB 7,504.5 million, decreasing by 27.8% from 31 December 2024. Major liabilities included trade and other payables of THB 2,562.6 million; long-term borrowings with interest compensation from the Rubber Authority of Thailand (RAOT) totaling THB 3,345.2 million under the credit support program for rubber product manufacturers; and debentures of THB 959.3 million. The decrease in total liabilities was mainly due to the repayment of short-term loans, long-term borrowings, and debentures during the year.
Total Shareholders’ Equity
Shareholders’ equity was THB 37,241 million, decreasing by 3.3% from 31 December 2024.
Capital Expenditures and Sources of Funds
In 2025, the Company’s capital expenditures declined compared to 2024 due to lower investments in financial assets, with net financial asset investments totaling THB 930.1 million. Meanwhile, expenditures for the acquisition of property, plant and equipment and intangible assets amounted to THB 875.8 million.
Research and Development (R&D) Expenditures
In 2025, the Company had R&D expenditures in amount of THB 67 million. The Company focused on and supported R&D activities related to new product development, improvements in production efficiency, and energy conservation within the organization, aiming to drive innovation at both the product and process levels. During the year, the Company continued to enhance its existing product portfolio in response to user requirements, including improvements to surgical gloves to facilitate double-gloving for medical personnel; natural rubber gloves with Double Chlorination; nitrile gloves with reduced residual zinc levels; nitrile gloves with Diamond Texture for industrial users; and Latex Powder-free long-cuff gloves for enhanced safety during use, etc.
In addition, the Company promoted and invested in the adoption of various knowledge and technologies across the organization, including Automation and Digitalization, to enhance organizational productivity and improve production efficiency. Key initiatives included the Gloves Defect Detection Project, which utilizes vision cameras combined with AI vision deep learning to detect and classify defective gloves, improving productivity by up to 50%; the QC Digitization Project, which applies handheld devices integrated with SAP to the QC WIP and packing processes, improving productivity by up to 36% and eliminating all paper usage; and the Smart Energy System Project, which developed a dashboard monitoring system integrated with sensors to collect and monitor real-time energy consumption with up to 99% accuracy, enabling faster and more informed decision-making. Moreover, the Company continued to promote the development of intellectual property by filing patent applications with the Department of Intellectual Property for medical glove products both domestically and internationally. As of 31 December 2025, the Company had filed a total of three invention patent applications.
Other Analysis
| Title | Description | ||||||||||||||||||||||||||||||||||||||||||||||||||||||||||||||||||||||||||||||||||||||||||||||||||||||||||||||||||||||||||||||||||||||||||||||||||||||||||||||||
|---|---|---|---|---|---|---|---|---|---|---|---|---|---|---|---|---|---|---|---|---|---|---|---|---|---|---|---|---|---|---|---|---|---|---|---|---|---|---|---|---|---|---|---|---|---|---|---|---|---|---|---|---|---|---|---|---|---|---|---|---|---|---|---|---|---|---|---|---|---|---|---|---|---|---|---|---|---|---|---|---|---|---|---|---|---|---|---|---|---|---|---|---|---|---|---|---|---|---|---|---|---|---|---|---|---|---|---|---|---|---|---|---|---|---|---|---|---|---|---|---|---|---|---|---|---|---|---|---|---|---|---|---|---|---|---|---|---|---|---|---|---|---|---|---|---|---|---|---|---|---|---|---|---|---|---|---|---|---|---|---|---|
| Significant Events in 2025 | 1. Transfer and Dissolution of Sadao P.S. Rubber Co., Ltd. On 9 April 2025, the Annual General Meeting of Shareholders approved the transfer of all business operations of Sadao P.S. Rubber Co., Ltd. (“PS”) to the Company as part of the internal restructuring within the Group Company. Subsequently, PS was registered for dissolution and is currently in the liquidation process. The Company wrote off its investment in PS and recognized a loss from the dissolution of PS amounting to THB 22.8 million in the separate financial statements for the year 2025 2. Capital Reduction in Subsidiary Sri Trang Gloves Global Pte. Ltd. (STGG) On 1 September 2025, the Extraordinary General Meeting of Shareholders of STGG approved a reduction of preferred share capital in amount of USD 50 million, or approximately THB 1,733.0 million. After the capital reduction, STGG’s paid-up capital amounted to USD 255 million, comprising 20 million ordinary shares and 235 million preferred shares, at a par value of USD 1 per share. The Company received the proceeds from the capital reduction in September 2025 and recognized a loss of THB 116.6 million, presented under administrative expenses in the separate financial statements. 3. Share Repurchase Program for Financial Management On 18 September 2025, the Board of Directors approved a share repurchase program for financial management purposes with a total budget not exceeding THB 1,500 million, covering up to 200 million shares (par value THB 0.50), representing 7.68% of the total issued shares. The repurchase period spans six months from 22 September 2025 to 20 March 2026. Shares will be repurchased solely through the SET, and the resale period will commence six months after completion of the repurchase and must not exceed three years. 4. Flood Incident in Songkhla Province In November 2025, the Company was affected by flooding in the surrounding areas of Hat Yai District, Songkhla Province, where some of its manufacturing facilities are located. The Company recognized damages from this event as non-recurring items in 2025. Although the affected facilities were covered by insurance, the Company expects to receive compensation from the insurer in 2026. Most of the losses were recognized in the fourth quarter of 2025. 5. Recognition of Interest Compensation from the Rubber Authority of Thailand (RAOT) The Company received interest compensation under the support program of the Rubber Authority of Thailand (RAOT) in amount of THB 88.8 million in 2025, decreasing from the prior year, as in 2024 the Company recognized such income together with interest compensation during construction in amount of THB 483.2 million. | ||||||||||||||||||||||||||||||||||||||||||||||||||||||||||||||||||||||||||||||||||||||||||||||||||||||||||||||||||||||||||||||||||||||||||||||||||||||||||||||||
| Key Financial Ratios | Interest Coverage Ratio In FY2025, Interest Coverage Ratio was 11.21 times, decreasing from 11.72 times in the previous year, mainly due to lower earnings before finance costs, income tax, depreciation and amortization (EBITDA). Current Ratio As of 31 December 2025, Current Ratio was 2.17 times, increasing from 1.94 times as at 31 December 2024, mainly due to a greater decrease in current liabilities compared to current assets. Cash Cycle In FY2025, Cash Conversion Cycle was 49.75 days, increasing from 47.74 days in the previous year. The increase was mainly due to longer Days Sales Outstanding (DSO) and Days Inventory Outstanding (DIO), despite an extension in Days Payables Outstanding (DPO) as well. Return on Assets (ROA) Return on Assets for the year ended 31 December 2025 was 2.1%, increasing from 1.8% as of 31 December 2024, following an improvement in the Company’s net profit at a proportionally higher rate than the increase in average total assets. Return on Equity (ROE) Return on Equity for the year ended 31 December 2025 was -0.3%, decreasing from 2.6% as of 31 December 2024, in line with the decrease in the Company’s net profit. Net Interest Bearing Debt Ratio (Net IBD) to Equity As of 31 December 2025, the Net IBD to Equity Ratio was 0.04 times, decreasing from 0.05 times* as of 31 December 2024, mainly due to reductions in short-term borrowings and debentures. *Note: Including current financial assets in the form of fixed deposits with maturities of more than three months as short-term investments.
*Dividend payment for the year 2025: The Company reported a net loss of THB 116.20 million in the separate financial statements for 2025; therefore, the dividend payout ratio for the year 2025 cannot be calculated. **Dividend payment for the year 2023: The Company reported a net loss of THB 45.30 million in the separate financial statements for 2023; therefore, the dividend payout ratio for the year 2023 cannot be calculated. | ||||||||||||||||||||||||||||||||||||||||||||||||||||||||||||||||||||||||||||||||||||||||||||||||||||||||||||||||||||||||||||||||||||||||||||||||||||||||||||||||
| Corporate Tax Policy | 1. Tax Code of Conduct The Company is committed to upholding corporate governance in taxation by ensuring transparency and full compliance with all applicable tax laws and regulations in conducting business and managing tax matters, as follows:
2. Tax Risk Management The Company aims to embed risk management into its business operations to support stable and sustainable lon-term growth. Tax risk management includes the following:
| ||||||||||||||||||||||||||||||||||||||||||||||||||||||||||||||||||||||||||||||||||||||||||||||||||||||||||||||||||||||||||||||||||||||||||||||||||||||||||||||||
| Sustainable Business Operations (ESG) | The Company places great importance on sustainable business operations throughout the entire value chain under the concept “Clean World Clean Gloves,” emphasizing product quality, ESG considerations, and preparedness for business risks and emerging risks, while aiming to create business value for stakeholders and build confidence among customers and consumers. Sustainability operations are carried out under the “SHARE” framework, consisting of five key principles: 1) Sustainability for Supply Chain and Fair Trade 2) Human Rights 3) Animal Welfare 4) Responsibility & Sharing Touch of Love and 5) Environmentally Friendly Technologies. In 2025, the Company undertook the following key ESG activities: Environmental Eco-Friendly Products “Clean World Clean Gloves”
Sustainable World, Sustainable Organization
Social Internal Social Responsibility Sustainable Labor Risk Management
Knowledge Development for Sustainability
External Social Responsibility Sustainable Communities, Sustainable Company
Governance & Economic Sustainable Business Value Chain Management
| ||||||||||||||||||||||||||||||||||||||||||||||||||||||||||||||||||||||||||||||||||||||||||||||||||||||||||||||||||||||||||||||||||||||||||||||||||||||||||||||||
Debt Securities with Financial Ratio Requirements
Debt Securities with Financial Ratio Requirements Issued?
Yes
Can the Company Maintain the Reported Financial Ratios?
Yes
Explanation
As of 31 December 2025, the Company had borrowings comprising short-term loans, long-term loans from financial institutions, debentures, and lease liabilities in amount of THB 4,505.8 million (Please refer to Notes 14 and 18 to the Financial Statements for further details regarding maturities, interest rates, and outstanding commitments by currency). The Company is required to comply with certain key financial covenants on a quarterly basis, as follows:
Covenant | Condition | 1Q68 | 2Q68 | 3Q68 | 4Q68 | Compliance Result |
Long-term Loan Agreement | ||||||
Net Debt to Equity | Consolidated financial statements not exceeding 3:1* | 0.03 | 0.06 | 0.03 | 0.04 | Complied |
* Lease liabilities are excluded from the calculation.
Factors That May Affect Financial Condition
Factors or Incidents That May Materially Affect Financial Condition
1. Supply and Demand Rebalancing in the Rubber Glove Industry
Following the rapid global capacity expansion during the COVID-19 pandemic, the rubber glove industry entered an oversupply situation beginning in 2022, leading to intense price competition. During 2023 – 2024, the excess supply gradually began to rebalance as several manufacturers reduced production capacity, postponed new investments, and customer inventory levels returned to normal. As a result, overall industry utilization improved. In 2025, new capacity additions from certain producers are expected to continue entering the market, maintaining pricing pressure. In addition, the United States’ reciprocal tariff measures have created volatility in global demand movements, affecting glove pricing across global markets.
The Company has implemented a production restructuring strategy since 2023, including postponing or cancelling certain expansion projects and discontinuing low efficiency production facilities. These actions help optimize the cost structure and maintain utilization at levels consistent with market conditions.
Despite improving demand and supply trends, price competition remains a key pressure on the industry. The Company therefore continues to enhance production efficiency through product mix optimization and the adoption of automation and artificial intelligence (AI) technologies in manufacturing and operations, effective cost management, and the introduction of new products to meet increasingly diverse customer needs.
2. International Tax Reform under the Pillar Two Income Tax Calculation Rules
The Organization for Economic Co-operation and Development (OECD) has implemented the 15% Global Minimum Tax (GMT) under Pillar Two, applicable to multinational enterprises with consolidated revenue exceeding EUR 750 million. The objective is to prevent profit shifting to low tax jurisdictions and reduce tax based competition for investment.
The Group Company falls under the scope of these regulations and has applied the exemptions related to recognizing and disclosing deferred tax assets and liabilities associated with Pillar Two. Several jurisdictions in which the Group operates have already enacted these rules. During 2025, the Group Company assessed the financial implications and recognized expected top-up tax expenses for subsidiaries operating in Singapore, recorded under income tax expenses in the financial statements. The Company continues to closely monitor regulatory developments to evaluate any additional future impact.
3. U.S. Reciprocal Tariff Measures and Global Trade Policy Uncertainty
In 2025, the United States introduced reciprocal tariff measures affecting multiple countries, resulting in volatility in global trade flows, import costs, and competitive structures in the rubber glove market. The U.S. Trade Representative announced tariff increases on medical and surgical rubber gloves imported from China, raising the rate from 7.5% in 2024 to 50% in 2025 and 100% in 2026. Additional reciprocal tariff measures were also implemented on various countries.
The higher U.S. tariffs on Chinese gloves have shifted competitive dynamics, enhancing the competitiveness of Thai and Malaysian producers, particularly in the synthetic rubber glove (NBR) segment, which has strong demand in the U.S. market.
While these measures present opportunities for the Company to increase market share in the United States, the Company continues to monitor U.S. and Chinese trade policy developments closely, including the potential expansion of tariffs to other major glove producing countries such as Malaysia, Vietnam, and Indonesia.
Other Projects or Research
| Title | Description |
|---|---|
| Significant Factors Affecting the Company’s Ability to Maintain and Enhance Its Competitiveness, and Their Impact on Operating Results and Financial Position | 1. Enhancing production efficiency and creating a cost advantage over competitors. Although the Company’s product structure focuses on the production of natural rubber gloves, the strong value chain supported by its major shareholder, who is a global leader in natural rubber production, provides advantages in access to raw materials, raw material costs, and visibility of raw material price movements. However, the Company continues to improve its cost competitiveness by seeking and enhancing production processes to increase efficiency, as well as adjusting work processes to be more flexible, reducing complicated steps, and increasing the speed from receiving orders to delivering products to customers continuously. 2. Maintaining product diversity to meet the needs of customers across various industries and countries, which requires creating flexibility in the production process to manufacture a wide variety of products and export under customers’ packaging. Approximately 82.3 percent of sales remain OEM products for many global brands, helping to maintain cost competitiveness. In addition, continuous efforts are made to develop new products that meet the needs of different customer groups, such as Specific Chemical Free gloves for food operators and Diamond Textured gloves for heavy duty use in other industries. This includes improving existing production lines to maximize product variety, as well as developing new products and creating new concepts for the industry to influence glove usage behavior. Examples include the development of Non-detectable Protein Gloves to encourage customers to use natural rubber gloves without concerns about protein allergies while also supporting environmental friendliness. Once new products receive approval from the relevant authorities, efforts must be made to expand market acceptance in various markets to increase production volume and achieve Economy of Scale. 3. Strengthening Resilience to Switching in Glove Demand by enhancing its ability to switch production between natural rubber gloves and nitrile gloves. The Company’s new generation machinery provides higher flexibility in changing raw materials to produce various types of gloves, with low downtime and similar levels of production efficiency. 4. The Company continues to focus on modernizing its production technology and operational processes to enhance agility and stay responsive to changes in the world and in the industry. Various forms of automation have been introduced into the production process and product quality inspection. The Company has also invested in artificial intelligence (AI) across several functions to increase work efficiency and reduce dependence on labor in many areas, both in the production process and in administrative operations. 5. Focusing on becoming a Green Glove Manufacturer by driving business growth while protecting and enhancing the environment, promoting social equality and fairness, and upholding the highest standards of corporate governance. These efforts contribute to the transition toward a sustainable low carbon society and increase the importance of maintaining responsible relationships across the value chain. Emphasis on selecting buyers and suppliers who adhere to ESG principles is expected to become a key requirement not only in regions with strong ESG commitments such as the European Union, but also in many countries worldwide, which are increasingly adopting similar practices to identify value chain partners who demonstrate genuine and verifiable ESG compliance. |